
A simple guide to A/B testing for data analysts: how to plan a test, read the numbers, run it in Python and explain your decision in an interview.
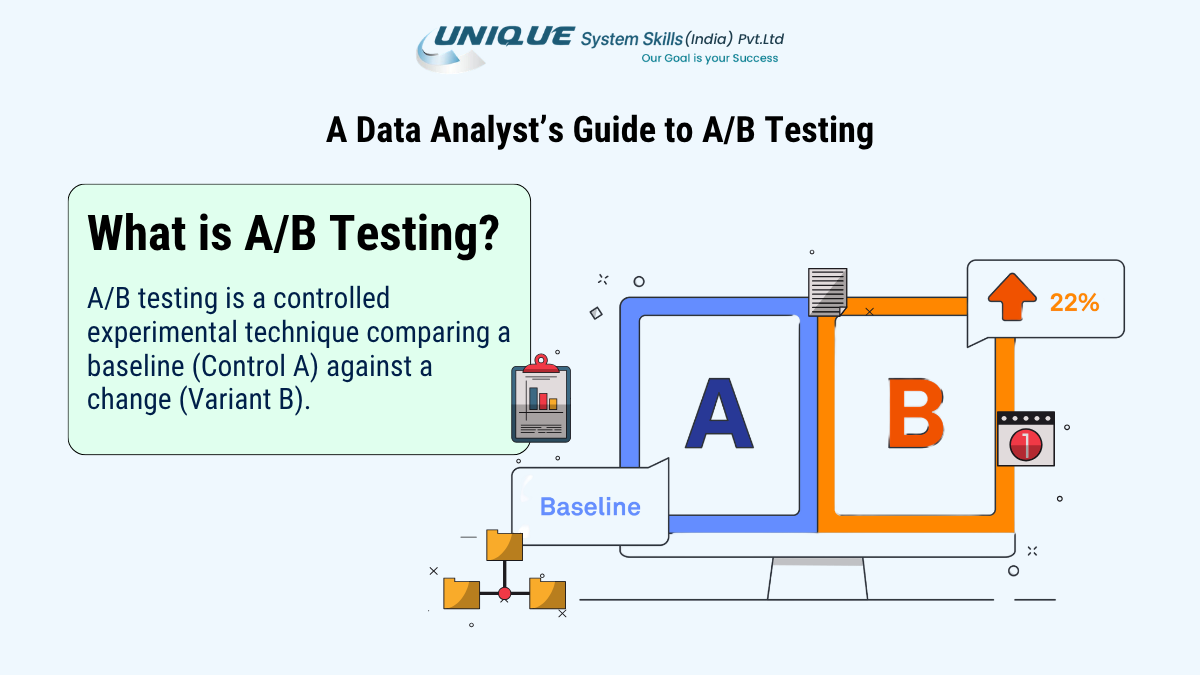
A/B testing for data analysts means splitting users at random into a control group (A) and a variant group (B), changing one thing for B, and using statistics to decide if the difference is real, big enough to matter and safe to ship. The method is simple. The hard part is discipline: fix your metric and sample size before launch, run the full time, check the data for errors, and judge business value, not just a p-value. All numbers in this guide are made-up examples, and the Python code at the end uses the same ones.
If A/B tests feel like a pile of jargon, with null hypotheses, power and p-values arriving all at once, you are in good company. Most analysts learn the formulas first and the judgement later, often after a test goes wrong. And tests do go wrong. In one study, Fabijan and colleagues report that about 6% of the experiments at Microsoft showed a sample ratio mismatch, a sign that something in the setup was broken. That is why A/B testing for data analysts is as much about trust as it is about maths. Here is the whole flow at a glance, and then we start at the beginning.
_____________________________________
Hypothesis → Metrics → Sample size → Random split → Run full duration → Split check → Analyse → Decide
_____________________________________
Understand A/B testing and how data analysts compare a baseline (Control A) with a modified version (Variant B) to evaluate results and improve performance.
Start With Your Hypothesis and A/B Testing Metrics
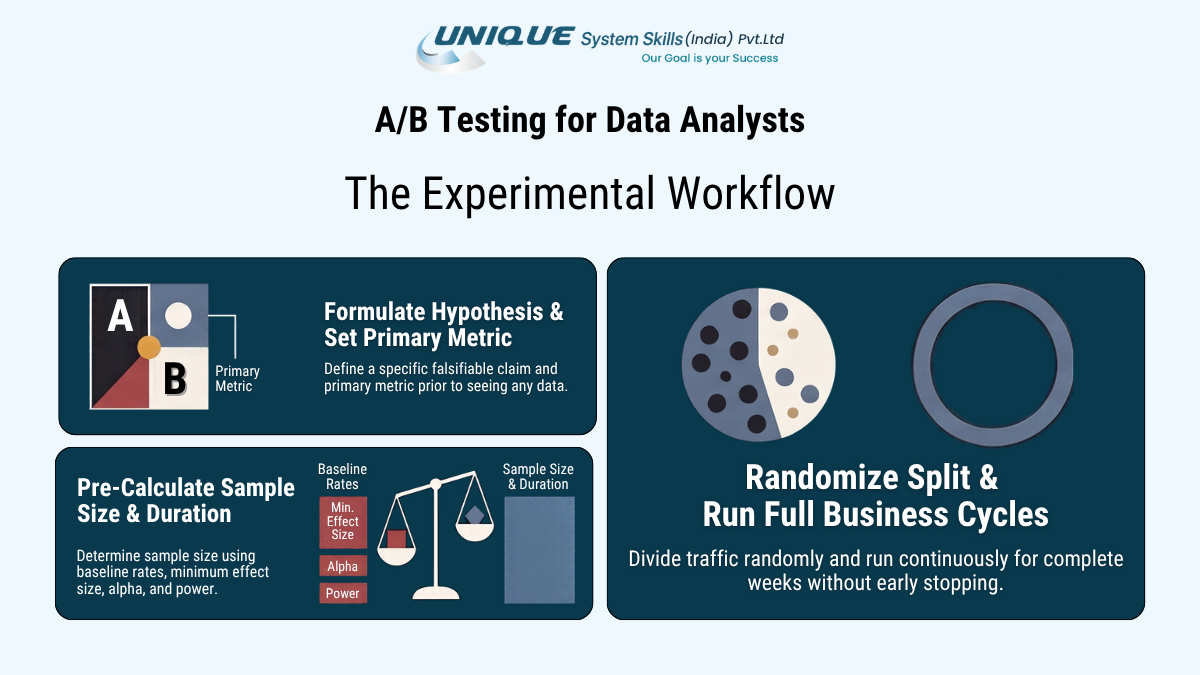
A test begins as a sentence and not a query. A good hypothesis is specific and can be proven wrong such that it links a change to a business result like “Cutting the signup form from five fields to three will raise account creation.” A vague idea like “a cleaner page will do better” teaches you nothing, because nothing can disprove it.
Next, pick your a b testing metrics before launch. Choose one primary metric, such as conversion rate, click-through rate or bounce rate. Then add guardrail metrics that protect the business, such as page load time, refund rate or revenue per user.
For an Indian shopping app that adds a UPI-first payment screen before a festive sale, purchase conversion is the primary metric. A slower page or more support tickets would be a warning, even if conversion goes up. Choosing metrics after you see the data is cherry-picking, because with enough metrics something always looks good by chance.
The last piece is the Minimum Detectable Effect (MDE), the smallest lift worth shipping after the cost of building and maintaining it. A 0.1% lift may be easy to detect with huge traffic and still not be worth the work. Once you know your MDE, you can turn it into a number of users, which is where the statistics begin.
A/B Testing Statistics in Plain Language
Five major ideas cover most of A/B testing statistics.
| Term | Plain meaning | Common default |
| Null hypothesis | There is no real difference between A and B | n/a |
| Significance level (α) | The false-alarm risk you accept | 5% |
| p-value | How surprising your data would be if the null were true | Below α counts as significant |
| Power (1 − β) | The chance of catching a real effect of MDE size | 80% |
| MDE | The smallest lift worth detecting | Set by the business |
These ideas matter because if you are given a sample sizea nd say your baseline conversion rate is 10%, your MDE is 2 points (10% to 12%), followed by α is 5% and power is 80%.
The standard two-proportion formula gives about 3,840 users per group, and calculators such as Evan Miller’s sample size calculator may differ by a few users. If 1,000 eligible users arrive each day, you need about eight days to collect them, you still need to run the test for two full weeks, because weekday and weekend behaviour differ and a test should cover whole business cycles.
Fixing this number in advance protects you from underpowered tests, where daily results swing wildly. It is also one habit that separates careful A/B testing for data analysts from guesswork. With the sample size set, the next question is what to do when the results arrive.
Statistical Significance vs Practical Significance
Suppose each group has 4,000 users. Then the control converts 400 users (10.0%) and the variant converts 460 (11.5%), that is a 1.5-point lift, or 15% in relative terms, with a p-value of about 0.03. The statistical analysis says the result is significant. But the 95% confidence interval shows the true lift could be anywhere from 0.14 to 2.86 points. Also, the observed lift of 1.5 points is below the 2-point MDE you planned for.
Here, the p-value says the lift is probably real, but it may not be big enough to pay for the change. If the change is cheap and the guardrails are healthy, shipping is reasonable. If it needs weeks of engineering, extend the test to narrow the interval, or improve the design and test again.
Now flip the situation. With 5,000,000 users per group, a move from 10.00% to 10.05% gives a p-value near 0.008, and the interval runs from about 0.013 to 0.087 points. That is statistically significant and also tiny, a 0.5% relative lift that may never repay the work.
This is the heart of statistical significance vs practical significance: the first tells you whether an effect is real, and the second tells you whether it is worth acting on. That decision rule is what makes A/B testing for data analysts useful to a business. But a good decision also needs a clean test, and that is where many analysts slip.
Avoiding Common Pitfalls in A/B Testing Analysis
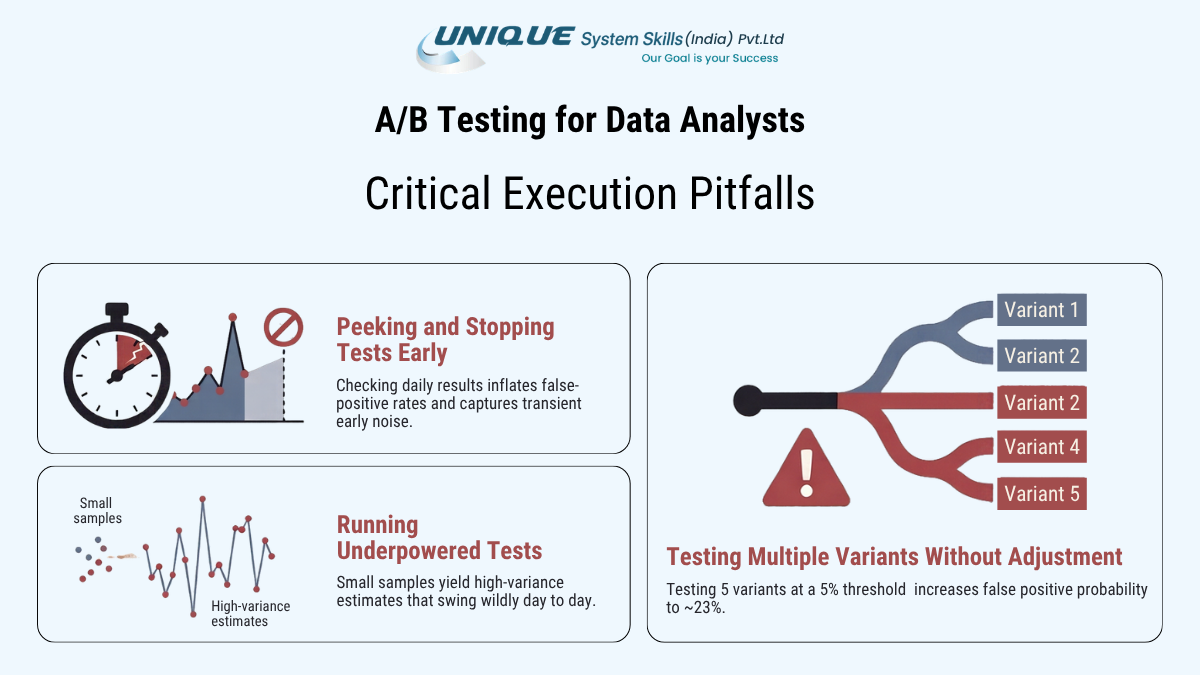
- Peeking: If you check results every day and stop the moment p falls below 0.05, you are running many tests, not one. If you peek 10 times, what you think is 1% significance is really about 5%. Sometimes, stopping at the first significant result can produce a false winner 26.1% of the time, more than five times the 5% you expected. An early “winner” on day three often disappears by day twenty. If you must look early, use a method built for it, such as sequential testing.
- Broken Split: You designed a 50/50 test, but 10,000 users arrive as 5,200 and 4,800. The chi-square test gives a p-value of about 0.00006. That sample ratio mismatch means the random split or the data pipeline is faulty, so investigate before you trust any lift. Good A/B testing for data analysts always checks the split first.
- Not Using Bonferroni Correction: If you test five variants at α = 0.05, the chance of at least one false positive rises to about 23% (1 − 0.95⁵). A Bonferroni correction fixes this by dividing α by the number of comparisons (0.05 ÷ 5 = 0.01).
- Not Running Full Cycles: New designs often get a short novelty bump that fades in two to three weeks, which is another reason to run full cycles. With the traps mapped, you can put the whole workflow into code.
Explore the A/B testing workflow for data analysts, from defining hypotheses and calculating sample sizes to randomizing traffic and running experiments across complete business cycles.
A/B Testing in Python
Anyone searching for a b testing in python wants a test they can run on their own data. The code below needs about twenty lines. It uses pandas for the data and statsmodels’ proportions_ztest for the two-proportion z-test, with the same numbers as the example above.
__________________________________
import numpy as np
import pandas as pd
from scipy.stats import chisquare
from statsmodels.stats.proportion import proportions_ztest
__________________________________
# 1. Prepare the data: one row per group
df = pd.DataFrame({
“group”: [“control”, “variant”],
“users”: [4000, 4000],
“conversions”: [400, 460],
})
df[“rate”] = df[“conversions”] / df[“users”]
__________________________________
# 2. Check the split first (sample ratio mismatch)
srm = chisquare(df[“users”]) # assumes an even split
print(“SRM p-value:”, round(srm.pvalue, 3))
__________________________________
# 3. Two-proportion z-test (variant first, so a positive z favours the variant)
count = df[“conversions”].values[::-1]
nobs = df[“users”].values[::-1]
z_stat, p_value = proportions_ztest(count, nobs)
__________________________________
# 4. Effect size and 95% confidence interval
p_c, p_v = df[“rate”]
n_c, n_v = df[“users”]
diff = p_v – p_c
se = np.sqrt(p_c * (1 – p_c) / n_c + p_v * (1 – p_v) / n_v)
low, high = diff – 1.96 * se, diff + 1.96 * se
print(f”z = {z_stat:.2f}, p = {p_value:.3f}”)
print(f”Lift: {diff*100:.2f} points, 95% CI: {low*100:.2f} to {high*100:.2f} points”)
__________________________________
You should see an SRM p-value of 1.0, then z = 2.17 and p = 0.030, and a lift of 1.50 points with a 95% interval from 0.14 to 2.86 points. Read them in order: the split is healthy, the result is significant, and the interval is wide. This is the whole workflow of A/B testing for data analysts in code. Swap in your own counts and this a b testing in python recipe works for any conversion test.
But, Code is only half the story, because a hiring panel also wants to hear how you think about the result.
A/B Testing for Data Analyst Interview
In an A/B testing for data analyst interview, the formulas are rarely the hard part. The panel is testing your judgement.
A classic scenario:
After 3 days, a test shows p = 0.03 and a 15% lift, and a manager wants to ship. The strong answer is no. Three days miss a full business cycle, daily checking invites peeking bias, a novelty effect may be inflating the lift, and the test is probably underpowered. Here, you can recommend running to the planned end date and confirming the guardrail metrics stay healthy.
The guardrail conflict:
The primary metric improves, but page load time gets worse. You should not ship on instinct. You can say that the breach needs a check first, estimate how much revenue the slower page could cost, and compare that with the gain before you recommend anything. Treat the guardrail as part of the result, not an afterthought.
The p-value:
A p-value of 0.03 does not mean there is a 97% chance that B is better. It means that if there were truly no difference, you would see a result at least this extreme about 3% of the time. A clear, correct answer to this signals real statistical skill.
A simple frame keeps you organized. Make sure that you restate the hypothesis, name the a b testing metrics (primary and guardrail), explain sample size and duration and mention the data check in the interview. Additionally, you should separate significance from practical value, and finish with a recommendation and its risks. Practising this frame on real data makes explaining A/B testing for data analysts feel natural in the room.
A/B testing mistakes, including early test termination, insufficient sample sizes, and multiple comparisons without adjustment, that can lead to unreliable results and false-positive conclusions.
Data Analytics Course in Pune: Build the Foundation
If you are choosing a data analytics course in Pune to build these skills, the Data Analytics Course at Unique System Skills covers Excel, SQL, Power BI and basic Python across seven modules, including real-world projects and case studies.
The classroom batches in Kothrud are capped at 15-20 students, and online options are available.
These are the tools an experiment analysis leans on:
- SQL to pull and group users
- Python to run the test
- Power BI to show the result
You can then practise the statistical analysis in this guide on top. If you also want the Python and machine learning side, the AI Fundamentals Course in Pune starts with Pandas and NumPy, then covers machine learning basics and model evaluation.
Conclusion
A/B testing for data analysts rests on a few habits:
- One clear hypothesis
- A primary metric chosen early
- A sample size fixed in advance
- A split check
- A full-length run
- A decision that weighs value as well as significance
None of these needs advanced maths, only discipline. Bringing that discipline to your next project or interview, with a worked example you built yourself can make your chances of getting the opportunity two-fold. Taking one of your own Python code and explaining the result out loud as if to a manager will teach you more than another week of reading.
Frequently Asked Questions
What is A/B testing in data analysis?
A/B testing in data analysis is a controlled experiment that randomly splits users into a control group (A) and a variant group (B), changes one thing for B, and uses statistics to judge whether the difference is real. A/B testing for data analysts also checks that the result is big enough to matter for the business.
The Data Analytics Course in Pune covers SQL, Excel, Power BI and basic Python, the tools an experiment analysis relies on.
Why is A/B testing important for data analysts?
A/B testing lets data analysts replace opinions with evidence. It shows whether a change truly caused an improvement, so teams avoid shipping features that only look good by chance. It is also a core interview skill, since panels test judgement on peeking, guardrail conflicts and p-value meaning.
What statistical tests are commonly used in A/B testing?
The two-proportion z-test is the standard for conversion-rate experiments. Analysts also use the chi-square test to check for sample ratio mismatch, confidence intervals to show the size of the lift, and a Bonferroni correction when comparing several variants.
For students and professionals, the AI Fundamentals Course in Pune builds the Pandas and NumPy foundation.
How do you analyze A/B test results?
To check A/B test results, you need to
- check the split for sample ratio mismatch
- Run a significance test such as the two-proportion z-test
- Calculate the lift and its 95% confidence interval
- Compare the result with your minimum detectable effect and guardrail metrics before deciding whether to ship.
You can learn this workflow in detail with Unique System Skill’s Data Analytics Course in Pune.
What is statistical significance in A/B testing?
Statistical significance means your observed difference would be unlikely to appear by chance if there were truly no difference between A and B. It is usually judged by a p-value below the significance level (α), commonly 5%. It shows an effect is probably real, not that it is large or valuable.
You can explore the statistics involved in A/B testing further with the AI Fundamentals Course in Pune and the Data Analytics Course In Pune.

